BARRY JULIEN | December 31, 2020
“It was the best of times, it was the worst of times, it was the age of wisdom, it was the age of foolishness, it was the epoch of belief, it was the epoch of incredulity, it was the season of light, it was the season of darkness, it was the spring of hope, it was the winter of despair.” One of the most famous openings of any novel, the Charles Dickens’ prose, though written in 1859, seems as fresh and poignant as ever. Longtime readers of this quarterly communique may recall the appropriation of this sentence many years ago, so please forgive the indulgence to employ it once again, as the parallels to the past year were too eerie to resist.
While 2020 proved a particularly challenging year and many were all too eager to close the book, lessons can be learned from the numerous dichotomies that were evident throughout the year. As Covid-19 spread from Asia to Europe and then landed on our shores, there were believers and non-believers in the severity of the virus, causing some to be prepared and take precautions while others that felt it unnecessary. In an age in which vast amounts of information are only a click away, there also exists volumes of misleading voices and, unfortunately, hordes of gullible followers. Few could argue that severe economic pain brought great despair, but, fortunately, government actions provided light to many. However, income inequality worsened as the haves and have nots had greatly contrasting experiences during the shutdown and recovery phases.
While existing for many years, the significant disconnect between Main Street and Wall Street was exacerbated this past year. Dire economic conditions hit Main Street hard and continues to linger, but after the swift downturn, Wall Street was quickly recovered. Those holding financial assets were able to enjoy the robust rebound in both equity and fixed income markets, while households without substantial investment portfolios were unable to benefit. The plummeting equity prices from earlier in the year, with the S&P 500 dropping nearly 34% from peak to trough (2/19/20 to 3/23/20) and roughly 20% over the entire quarter, were quickly replaced with an impressive rally that continued through year end.
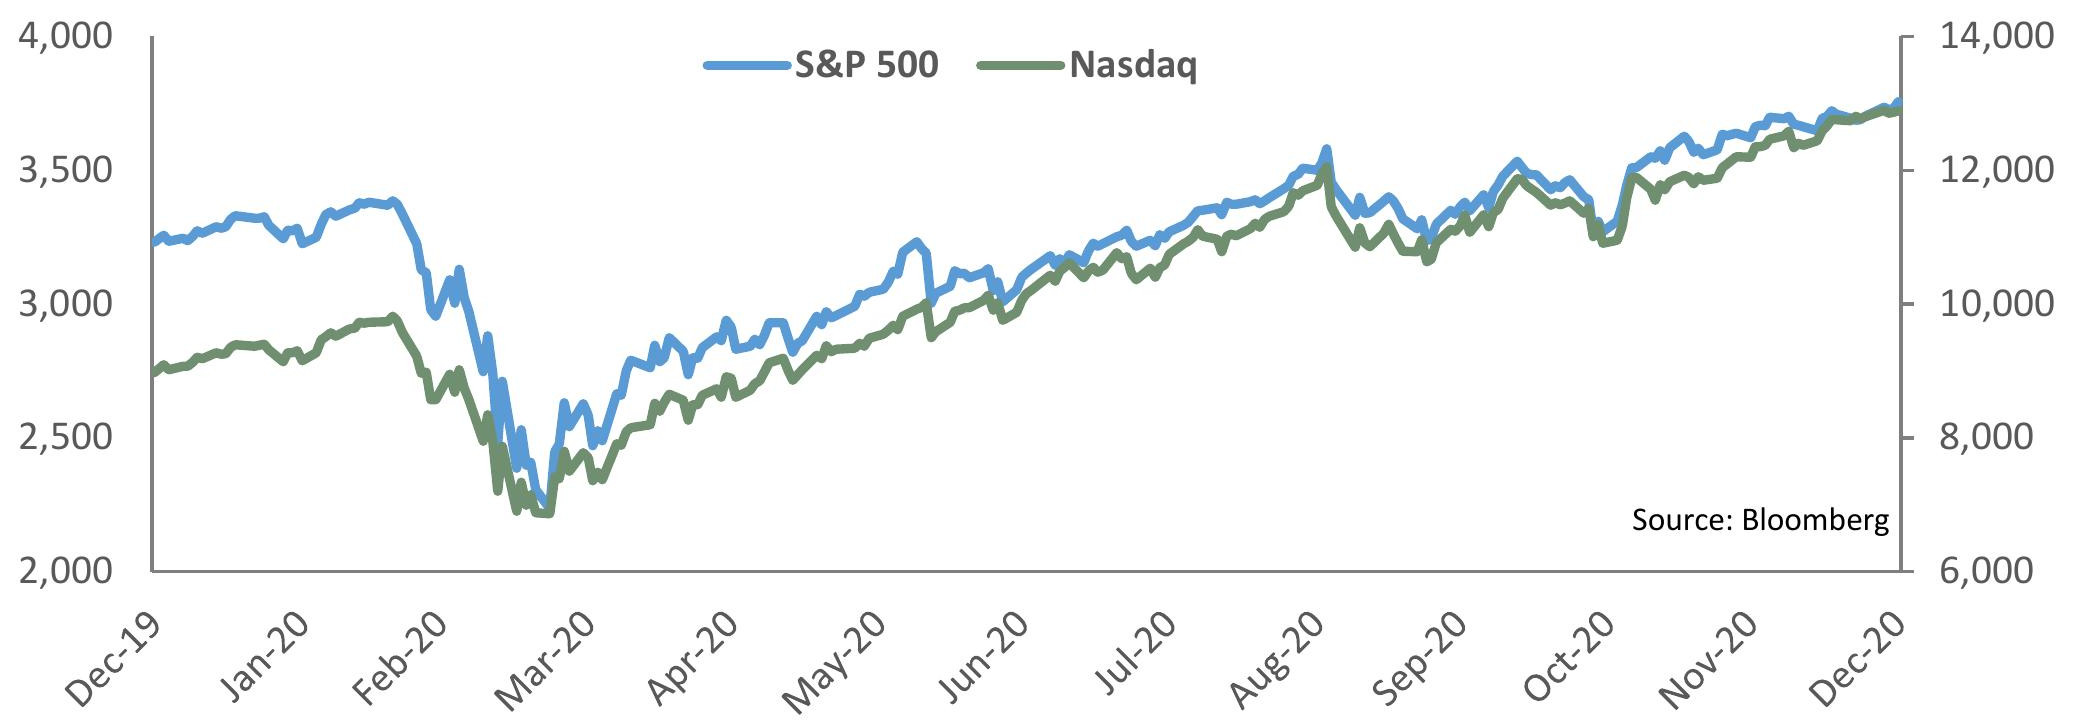
From its depths in March, the S&P 500 roared back to generate a total return exceeding 13% for the year and set numerous all-time highs, while the Nasdaq obliterated those gains with a stunning rally to register an annual gain of more than 45%. Still, within the stock market, there was also a substantial difference between growth and value. Dominated by the Information Technology sector, the Russell 1000 Growth Index gained 38.5%, while its value brethren, the Russell 1000 Value Index, was only able to produce less than 3% for the year.
As these stocks market records were being established, so too were there other less desirable records being surpassed. The number of Covid-19 cases, hospitalizations, and deaths were quickly accelerating and shattering previous records, with the more recent second wave easily overwhelming the statistics from the initial round. Certain industries, such as travel-related and most service-oriented businesses, bore the brunt of the forced business closures. Airlines and hotels, for example, saw patronage collapse by 90% or more in many cases. Contrastingly, those able to pivot business models and shift to working from home were able to better weather the impact. Demand for groceries and other household goods, computers, and exercise equipment skyrocketed, while movie theatres and gyms were vacant. Restaurants were under severe pressure, though quick service establishments were able to fare relatively well during these challenging times.
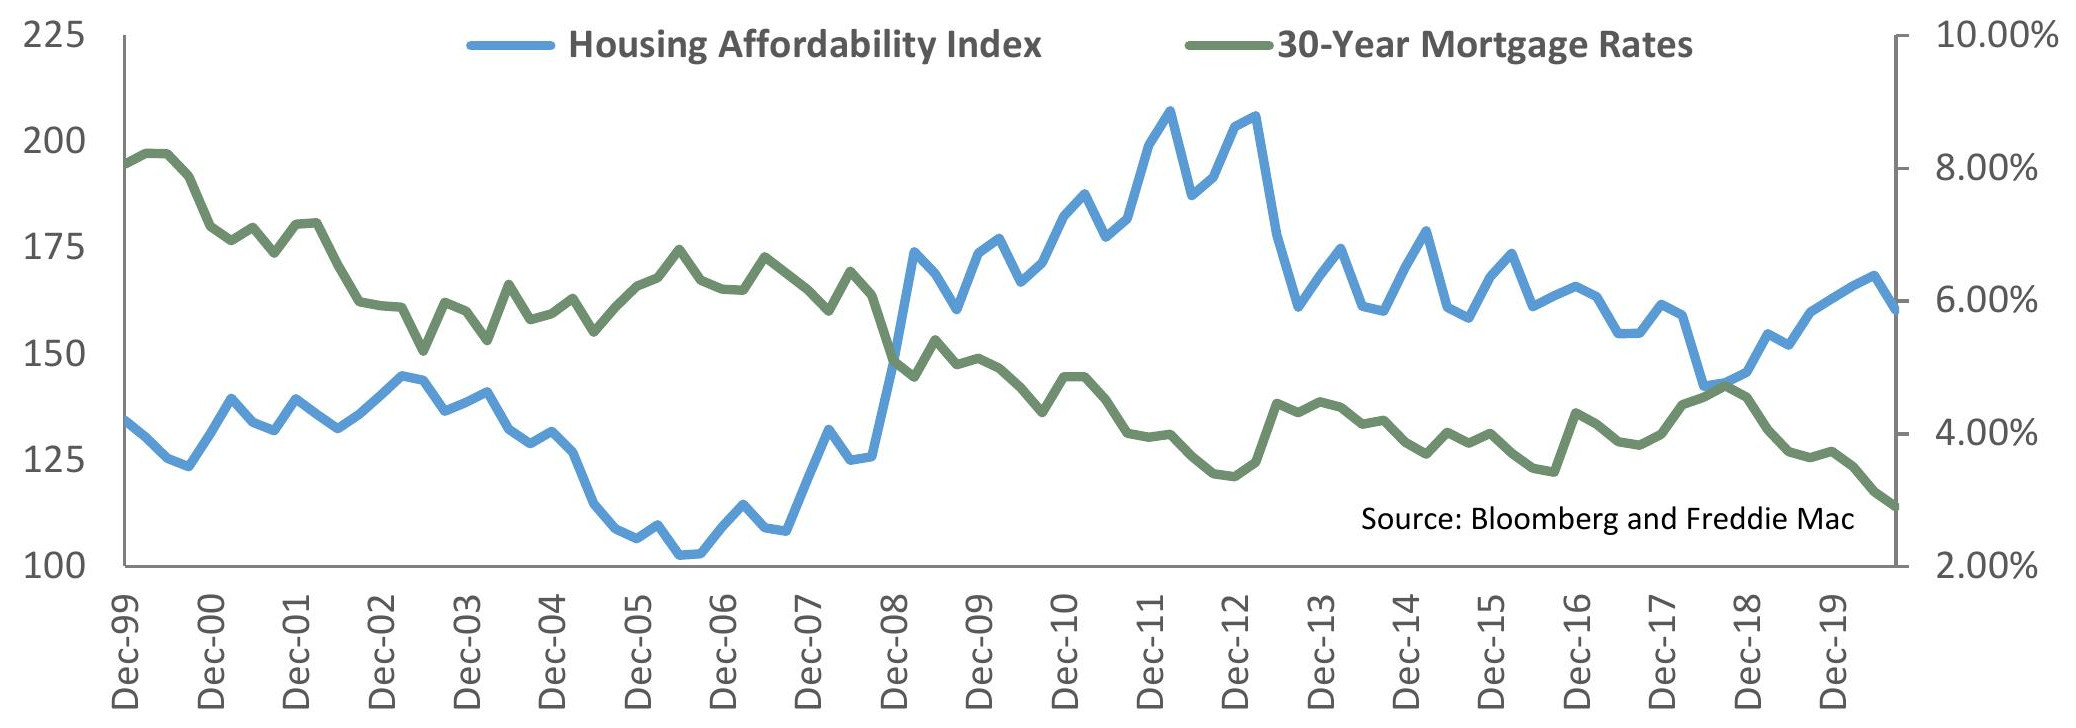
Similarly, suburban homeowners benefitted from the surge in housing prices and seemingly insatiable demand for new and existing homes. The backyards and extra square footage also aided families trying to cope during the shutdowns and stay-at-home measures. Record-low mortgage rates, falling below 2.75%, enabled refinancings and were an additional benefit to those fortunate enough to already own their dwelling. Moratoriums on foreclosures proved beneficial, too, enabling those out of work to maintain their residence and reduce some strain. Although renters were also able to stave off removals with a freeze on landlord evictions, the dearth of housing supply and heightened demand pushed prices considerably higher and caused affordability to fall to a 12-year low. Once again, owning real assets proved beneficial, yet those without property are now in an even weaker position.
As the end of the year approached, the disconnects seemed to worsen. A wave of hospitalizations and record-setting deaths contrasted with the daily stock market record highs. Despite another round of shutdowns in several cities and countries, optimism regarding financial markets could not be deterred. The expectation of another round of stimulus was certainly a factor in propelling equity valuations to all-time highs, but so, too, were the vaccine approvals and the initial rollouts. Though the speed of vaccinations has proved to be underwhelming, it has neither slowed the enthusiasm nor moderated the risk taking.
As the political winds shifted, new narratives emerged to justify the continuation of the rallying market. Initially, pundits projected a split government with the Senate remaining under Republican control. This outcome was preferred by several analysts, pointing to the historical performance under Congressional gridlock. However, with the growing possibility of a Democratic sweep, known as the blue wave, the narrative conveniently changed course again. This outcome, once feared due to the prospect of higher individual and corporate taxes, became welcomed by investors as the anticipation of additional fiscal stimulus measures overwhelmed the likelihood of tax hikes.
Justification for market moves and bullish projections is hardly a new phenomenon. In fact, there are still periods of disappointing economic releases that prompt rallies based upon the rationalization that lower growth will engender expanded monetary and fiscal ease. Interestingly, though, positive economic news still has generated upward market moves due to excitement over the recovery.
A great divide also exists between inflation and deflation advocates. Having twice attempted to cure recessions that were characterized by debt-laden households, businesses, and governments, the prescribed medicine was issuing and encouraging additional indebtedness. Thus, some analysts argue that layering more debt upon already debt-heavy borrowers will further reduce the marginal effectiveness of leverage. As such, the inability to generate ample growth and the difficulty to service this exploding debt load will prolong the sluggish growth and low inflation environment.
Contrastingly, proponents of an emerging inflation threat put forward several compelling arguments. The printing press has been working overtime, flooding the economy with liquidity. Monetary measures are growing at unprecedented rates, with M1 Money Supply expanding an astonishing 65% in 2020. However, monetary velocity, which is integral to inflation, has largely been absent. Large-scale vaccinations and the re-opening of the economy will increase monetary exchanges and push velocity higher. The recovery should gain momentum as massive fiscal stimulus, including an upcoming infrastructure proposal, high savings rates, and pent-up demand will elevate aggregate demand and prices. Wage pressures have already been noticeable, with average hourly earnings jumping 0.8% in December, bringing year-over-year wage gains to an impressive 5.1%. Supply-side bottlenecks, highlighted by Covid-19 manufacturing slowdowns, coupled with geopolitical tensions and heightened nationalism, will hasten the de-globalization efforts and raise input prices.
Market-based indicators also provide ample support for the inflation forecasters. Broad commodity indices surged, with the Commodity Research Bureau BLS Spot Index rising more than 10% last year. The closely followed breakeven inflation rate, a market-implied inflation measure that is calculated as the difference between the yield on the 10-year U.S. Treasury note and the 10-year TIPs, had been predicting an inflation rate as low as 0.55% back in March. However, aggressive monetary easing from the Fed and fiscal support from Congress dramatically improved market conditions and investor expectations for future growth and price levels. Expected inflation steadily climbed during the final three quarters and recently passed the psychologically important 2% level. Over the past five years, the highest that this implied inflation rate hit was 2.18% in April 2018. Thus, a breakthrough above 2.18% would mark another milestone in the rebuilding of inflation expectations. Concurrently, the yield curve has experienced consistent steepening since March. The 2-year to 10-year spread recently topped 90 basis points, a significant increase from 11 basis points in late February and the slight yield curve inversion that occurred in August 2019. With the Fed having clearly stated its intention to maintain the Fed Funds rate near zero for the next couple years, as well as its adoption of an average inflation target of 2%, further yield curve steepening is likely. Since the Fed has also repeatedly mentioned its desire to let the economy run hot for a while, investors should prepare for the impact from heightened headline inflation figures over the next several quarters.
The pronounced disconnect between the underlying economic fundamentals and market valuations has widened, prompting forecasts for a long overdue correction. Either growth and corporate earnings must expand to justify current valuations or market prices must adjust downward to meet more realistic metrics. There have been many times when markets overshoot fair value, including the more recent dotcom and real estate bubbles, and these can persist far longer than many people expect. However, history illustrates that a day of reckoning is inevitable. Judging by the overwhelming evidence of investor complacency, though, it appears that few will be prepared for a re-pricing of risk.
As Dickens so eloquently declared, it can be both an age of wisdom and one of foolishness, an epoch of light and one of darkness. With the inherent freedoms enjoyed in our democracy, great differences in people and opinion are inevitable. However, the “melting pot” characterization of the U.S., in which a variety of races and cultures can coexist and thrive as a cohesive whole, has come under strain. The influence and impact of social media has polarized many factions, raising tensions and sparking riots. At the same time as there are calls for retribution, numerous voices are pleading for unification. The existence of different realities, with a growing difficulty in separating fact from fiction, is also of great concern.
Thus, with vastly differing individuals holding distinct world and economic outlooks, investors must be aware of the potential volatility across social, political, and economic spectrums. Should income inequality continue and worsen, social strains would exacerbate. Political unification or further divisions will prove important for the stretched social fabric and the ability to pass future legislation. The developing debate about inflation versus deflation will impact Fed decisions and market fortunes during the next few years. Considering such varied potential outcomes, investors may be hopeful for the best of times, yet must also prepare for the worst.
Barry P. Julien, CFA®
Chief Investment Officer & Portfolio Manager
Equities
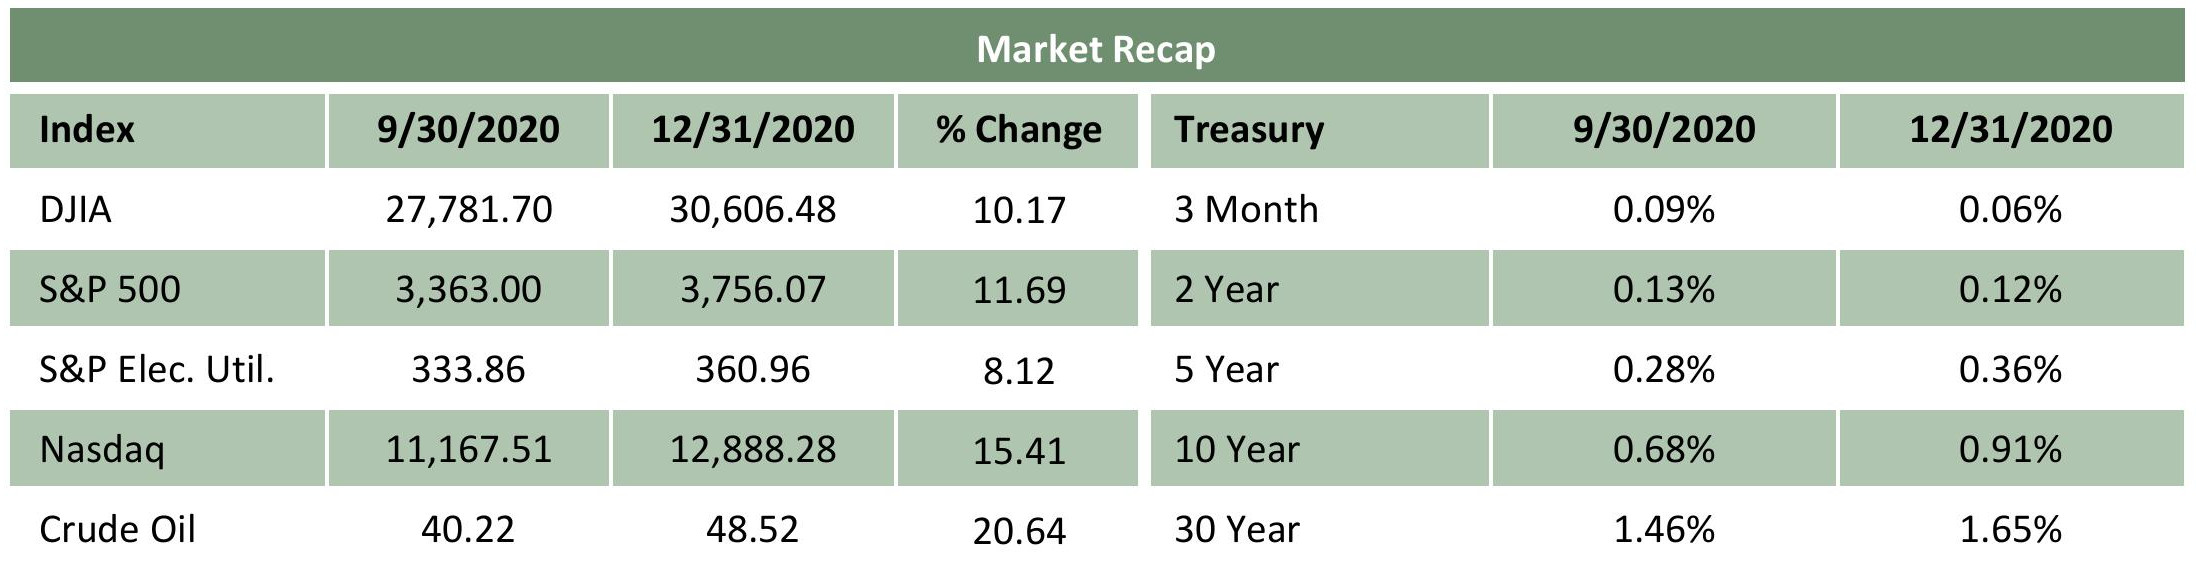
Following a robust Q3 rally, equities were able to not only maintain the momentum but surpass the upward move from the prior quarter. The vaccine approvals certainly contributed, as did optimism about additional fiscal stimulus and removal of some uncertainty following the election. The S&P 500 gained 12%, the Dow Jones added in excess of 10%, and the Nasdaq soared more than 15% during the period. Bucking the recent trend, value stocks outperformed growth names as investors rotated into more cyclical holdings in anticipation of the economic recovery. Though valuations are stretched, corporate earnings estimates are expected to rebound meaningfully from subdued levels.
Bonds
As economic optimism improved, bond yields marched higher. With the Fed’s commitment to maintain the funds rate near zero, shorter US Treasury yields were little changed and intermediate and longer-term benchmark yields bore the brunt of the adjustment. Thus, the yield curve continued its steepening move and, at more than 90 basis points, reached its highest level since 2017. Brighter prospects and a persistent desire for yield drove investment grade and high yield corporate bond spreads tighter, while anticipation of a hike in marginal tax rates fueled municipal bond demand.
Commodities
After topping $2,000 per ounce in August, gold gave back earlier gains as investors took profits, finishing just below $1,900. Other metals, however, continued their ascent, with silver gaining more than 13% during the quarter. Excitement about the vaccine and the potential for a resumption in travel, as well as the expectation for a decline in production, prompted a 20% surge in crude oil. As the West Texas benchmark price neared $50 per barrel, higher fuel stockpiles and shaky demand caused the rally to fizzle.
Currencies
Global currency debasement remained in full force as central banks maintained elevated levels of monetary and balance sheet growth. Having steadily faded since March, the U.S. dollar’s descent continued as the dollar index settled below 90 at year end. Economic recovery and additional fiscal stimulus may pressure interest rates higher and reverse the depreciation of the greenback.
This was prepared by Oakhurst Capital Management, LLC (OCM), a federally registered investment adviser under the Investment Advisers Act of 1940. Registration as an investment adviser does not imply a certain level of skill or training. OCM Form ADV Part 2A & 2B can be obtained by written request directly to: 1875 Century Park East, Ste 950, Los Angeles, California 90067. The information herein was obtained from various sources. OCM does not guarantee the accuracy or completeness of such information provided by third parties. The information in this presentation is given as of the date indicated and believed to be reliable. OCM assumes no obligation to update this information, or to advise on further developments relating to it. Neither the information nor any opinion expressed constitutes an offer, or an invitation to make an offer, to buy or sell any securities. Any return expectations provided are not intended as, and must not be regarded as, a representation, warranty or predication that the investment will achieve any particular rate of return over any particular time period or that investors will not incur losses. Past performance is not indicative of future results. This is for informational purposes only. It does not address specific investment objectives, or the financial situation and the particular needs of any person. An index is a portfolio of specific securities, the performance of which is often used as a benchmark in judging the relative performance of certain asset classes. Indexes are unmanaged portfolios and investors cannot invest directly in an index. An index does not charge management fees or brokerage expenses, and no such fees or expenses were deducted from the performance shown. The S&P Indices are widely recognized, unmanaged indices of common stock. The S&P 500 Index is recognized as a gauge of the large cap U.S. equities market. The S&P Electric Utilities Index is a sub-industry group within the S&P 500 Index. The Dow Jones Industrial Average (DJIA) is a price-weighted average of 30 significant stocks traded on the New York Stock Exchange (NYSE) and the NASDAQ. The NASDAQ Composite is a stock market index of the common stocks and similar securities (e.g. ADRs, tracking stocks, limited partnership interests) listed on the NASDAQ stock market. The Commodity Research Bureau Index (CRB) is an index that measures the overall direction of 19 commodity sectors. The Consumer Price Index (CPI) measures changes in the price level of market basket of consumer goods and services purchased by households. All data sourced from Bloomberg as of September 30, 2020, unless noted otherwise.