BARRY JULIEN | December 31, 2021
Having closed out another very impressive year for risky assets, investors turn their attention to the upcoming quarters as they search for signs that will provide clarity and predictive powers. The unprecedented involvement of the Federal Reserve in our financial markets, though, has muddied the typical metrics in which many investors have historically found comfort. In the equity market, investors often focus on ratios such as price-to-earnings, price-to-book, and price-to-sales, while also employing models like the discounted cash flow approach. Interest rates have a meaningful influence on valuations of all assets, with the U.S. dollar rates always being the primary benchmark across global markets. Thus, an accurate prediction of U.S. Treasury yields can provide a significant advantage for analyzing risk-return attributes and optimally allocating assets. However, the Fed, through its zero-interest rate policy and quantitative easing program has suppressed rates for years, complicating the reliance on U.S. Treasury yields for valuation and predictive assessments.
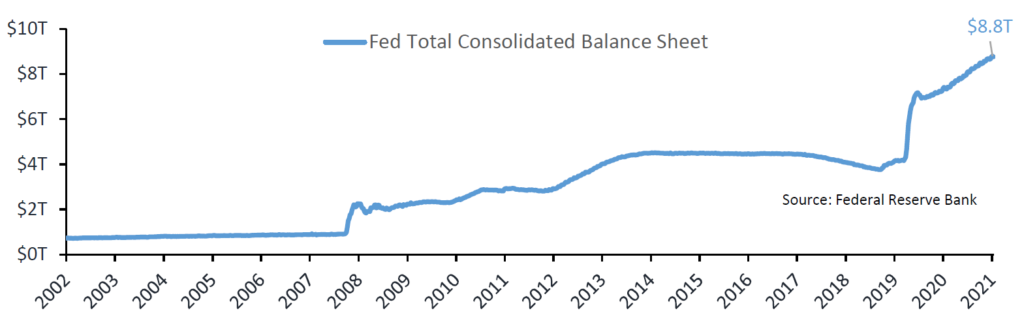
The expanding Fed balance sheet has been a primary driver of liquidity and propped up asset values, both financial and real. Having purchased $120 billion per month of U.S. Treasuries and mortgage-backed securities, the Fed amassed a hoard of nearly $8.8 trillion in bonds through its massive quantitative easing program. In doing so, benchmark bond yields were suppressed far below fair value, causing one of the most important indicators to be of little importance to market participants. In addition to the absolute nominal US Treasury yields, the changing shape of the yield curve has been a reliable data point to help predict the economic outlook. The Fed’s market manipulation has also altered this relationship, though information can still be derived as the yield curve either steepens or flattens over time.
Earlier in the year, following a clear uptick in headline inflation statistics, Fed Chair Powell and the rest of the central bankers adopted its transitory narrative. Based largely on its expectation that supply-chain disruptions would dissipate, the Fed broadcasted its belief that inflation would slow meaningfully in the upcoming quarters as manufacturing issues resolved and the economy fell back into a more normal growth environment. Although certain transitory items, including lumber and used cars, were unlikely to continue rising at the pace experienced earlier in 2021, these components comprised a relatively small
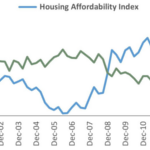
percentage of inflation indices. Contrastingly, larger influences on overall inflation, such as wages and housing, were just beginning to impact the indices and were likely to overwhelm transitory items and continue to pressure broad price levels higher for the foreseeable future. Though this viewpoint become increasingly obvious to many strategists and investors, the Fed was unwilling to abandon its narrative until very recently.
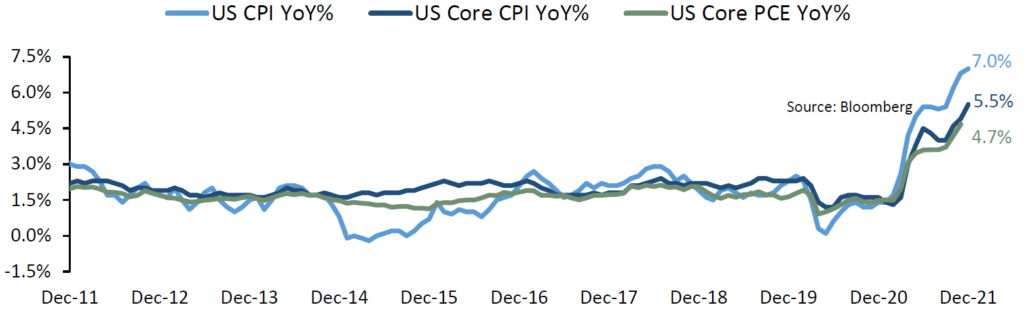
Following the September meeting, the Fed noticeably changed its tune, admitting that inflation was becoming problematic and reducing its sizeable monthly bond purchases was warranted. Between the November and December Fed meetings, though, inflationary pressures continued to build, with CPI reaching 6.8%, core CPI touching 4.9%, and core PCE hitting 4.7%. Many analysts began to predict that the recently commenced tapering of $15 billion per month and an expected QE end date in the summer would require a more severe reduction and earlier conclusion. In the December Fed minutes, the FOMC did, in fact, vote to hasten its tapering with double the earlier announced size, bringing its end to March. While this was widely expected, two additional changes provided a decidedly hawkish tone that represented more of a complete about face rather than simply a pivot. The voting members were now expecting three hikes of the Fed funds rate in both 2022 and 2023, with the first hike potentially in March, earlier than the June date that most were anticipating. While providing confirmation that the Fed was clearly nervous that it must increase vigilance in its fight against excessive inflation, the more surprising admission of a discussion to “quantitative tightening,” thereby reducing the size of its balance sheet, caught the markets off guard and introduced the notion that the Fed is “behind the curve.”
Having gone from the expectation of no rate hikes back in June to faster tapering, numerous rate hikes in 2022 and 2023, and quantitative tightening now, the Fed’s severe turnaround is likely indicative of a policy error that occurred in its continuation of emergency monetary policy well past its necessity. This will not be confirmed for several quarters, but the typical desire to have a clear, consistent, and stable policy path has been completely abandoned quite quickly. The Fed appears panicked, which may result in future policy moves that inflict great costs upon the economy as it attempts to get the upper hand on inflation.
Analyzing the market’s expectation for future inflation remains a crucial input for Fed decision makers and all investors. Without the benefit of the Fed’s dozens of highly credentialed economists gathering copious data, most market participants must rely upon various inflation indicators, both market derived and monthly surveys. One of the most watched gauges is the market-implied breakeven inflation rate. The ten-year breakeven rate, calculated as the difference between the yield on the ten-year U.S. Treasury and the ten-year TIPS, moved up in September following the Fed’s initial pivot and announcement of tapering, reaching a peak of 2.75% in November. However, as the primary inflationary releases increased, hitting 40-year highs, and the Fed was forced to ramp up its monetary policy responses, the ten-year breakeven rate dropped to 2.50%. Therefore, the admittance that the Fed is losing its fight against price stability confusingly prompted inflation expectations to fall rather than rise. Did the Fed’s drastic change already convince investors that inflation will be quickly tamed? That is unlikely. Instead, the information obtained from the market-implied inflation measures has become much less reliable due to the Fed’s dominant involvement in the bond market. Not only does the Fed own more than 25% of all outstanding nominal Treasuries and TIPS, but it has purchased more TIPS than the Treasury has issued over the past two years.
Therefore, the Fed’s unprecedented build up of bonds on its balance sheet has skewed market signals. Bond and equity investors cannot derive reliable information about inflation perceptions based upon the yields of nominal Treasuries and TIPS, nor their difference, which is meant to represent the breakeven inflation rate.
If benchmark rates are manipulated and no longer useful, how can one remain confident that one of the best predictors of the economy, the yield curve, remains insightful? The yield curve is simply the differential between the ten-year Treasury and two-year Treasury yields, and although there is ample evidence that the Fed’s massive QE programs has suppressed rates meaningfully, it is less clear that there has been any deliberate effort to sway the shape of the curve. Unless Fed purchases were tilted in a manner to influence specific maturities, of which there is no evidence over the past couple years, then investors can derive some information from the shape of the curve. Due to short-term rates being pinned near zero since the early days of COVID, the steepness of the curve may not be easily compared to other periods. However, though the absolute steepness or flatness of the curve may be of dubious value, the second derivative, or the change in the shape of the curve, should still be a useful predictor. Following the numerous rate cuts in March 2020, the yield curve steepened significantly, signifying the growing hopes for improved economic growth. While the curve flattened some over the next several quarters, it remained relatively steep at 100 basis points or so. Strong GDP growth and healthy corporate profits helped to maintain the optimism, with the curve steepening again to 130 basis points just a few months ago. However, as the Fed began to pivot, at first slowing the accommodation to the more recent surprise tightening of monetary policy, the yield curve flattened meaningfully. Higher interest rates and a reduction in the Fed’s balance sheet will reduce growth prospects as financing costs increase. In addition, a dampening of liquidity and a decrease in risk taking is likely to follow, sparking a spike in volatility.
Monitoring the shape of the curve will remain crucial in the months ahead. Should inflation continue to remain elevated and the Fed be forced to take additional steps to reign in prices, investors may begin to place a higher probability of a recession. The yield curve would indicate the growing risk of recession by flattening much more severely, perhaps even inverting. Conversely, any success in the taming of inflation may steepen the curve, with investors rolling back their expectations for future rate hikes and QT.
Since the Great Financial Crisis, monetary and fiscal policy have evolved to become increasingly influential on the real economy and financial markets. Due to this pervasive involvement, many traditional market signals have lost their efficacy. Although U.S. Treasury rates remain the most important prices in global markets, it has become more challenging to decipher valuable information from their levels. While this has also prompted some trouble with the yield curve, it remains an important indicator for the direction of the domestic economy and the expectation for future policy actions.
In the year ahead, decreased fiscal stimulus and tighter monetary conditions will prove challenging for markets. Already evident with the downturn in technology shares, stretched valuations in many sectors will be tested as Fed largesse is removed. The strength and duration of the robust economic recovery will be tested in the upcoming quarters. A soft landing is greatly desired by the Fed and many investors, though this would require a much-improved framework for inflation projections, which unfortunately does not yet exist. The optimistic outcome would require that supply-chain disruptions are quickly resolved, wage gains moderate, and goods and services price increases slow, enabling the Fed to stick to its current tapering plan and rate hike schedule without the need to reduce its balance sheet. A great deal needs to go right for this outcome to occur. With the fast-spreading Omicron variant wreaking havoc on workforces, the likelihood of this conclusion has diminished. Higher inflation is working its way through the system and is not going back to the sub-2% pace from the prior decade. Instead, wage pressures and higher shelter costs (housing, apartments) will persist and continue to keep broad price indices well above the Fed’s target. Growth will slow, but the relative health of household and corporate balance sheets will enable most to weather the current challenges and maintain a pace of expansion above recent history.
Based upon the most recent economic data and Fed communiques, it is important to prepare for financial market volatility as principal protection strategies grow in importance. Careful attention to the changing slope of the yield curve will provide insights into the economic future. With the expectation that rates will rise and the curve flatten, fixed income investors should defensively position portfolios, including minimizing duration exposure, take profits on higher beta holdings, and focus on generating substantial income through an overweight to floating-rate instruments. Though the adjustment to a new regime may become uncomfortable, eventually, wider yield spreads will improve the risk-return outlook and higher rates could provide much more attractive return potential.
Barry P. Julien, CFA®
Chief Investment Officer & Portfolio Manager
Market Snapshots
Equities
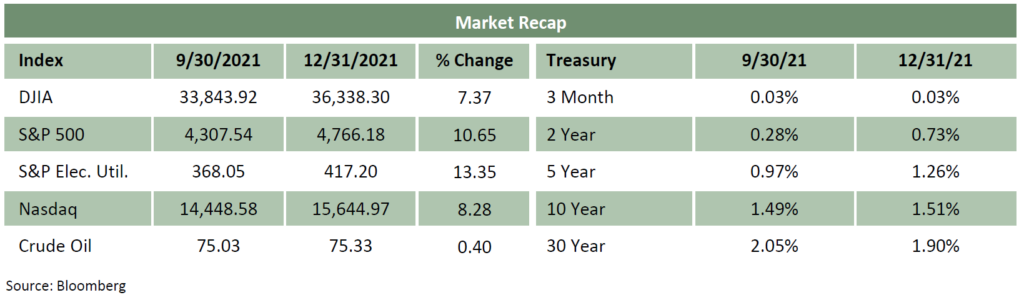
The major stock indices finished the year strongly, with the S&P 500 leading the way with a gain of 11%, while the Dow Jones added nearly 8% and the Nasdaq increased almost 8.5% for the quarter. The yearly gains topped 20% for each, as the S&P 500 again topped the others with its impressive gain of more than 28% for 2021. Despite these remarkable advances, the fourth quarter experienced some noticeable changes as small caps faltered and market breadth narrowed. Susceptible to higher rates, technology shares came under pressure, though indices maintained gains due to the continued increases from the few largest names. Tighter monetary policy may cause enhanced volatility in the months ahead.
Bonds
The growing concern over inflation was evident as shorter maturity Treasuries began to price in rate hikes in 2022. Once the Fed eventually changed its tune and pivoted to a more hawkish view, the yield adjustment gained traction. Over the quarter, while the two-year US Treasury yield increased from 0.28% to 0.73%, the move in the ten-year US Treasury was much more subdued, finishing at 1.51% from a start of 1.49%. This flattening of the yield curve is expected to continue as the Fed rushes to enhance its inflation-fighting efforts. Higher-quality corporate bonds experienced wider spreads, though high yield enjoyed modestly tighter yield spreads over the quarter. Municipals held in very well relative to most sectors, furthering its stretched valuations versus taxable bonds.
Commodities
Although crude oil prices stabilized and natural gas retreated significantly from its mid-quarter high, broader commodity indices registered solid gains over the quarter. West Texas Intermediate futures were able to finish the year at $75.21 per barrel, a modest gain from the previous quarter as Omicron fears abated. Gold prices pushed higher as investors turned to safe havens and inflation worries expanded, finishing at $1,828 per ounce. After its tremendous rise and fall earlier in the year, the rollercoaster ride in lumber continued as it gained more than 80% in the final quarter.
Currencies
As the Fed changed course and signaled tighter monetary conditions, the expectation for higher rates bolstered the U.S. dollar. The close of 95.67 represented an increase of 1.5% during the quarter, though it was well off its earlier highs. The maintenance of loose policy and the sizeable dollar yield advantage caused the euro and yen to fall versus the greenback. Cryptocurrencies soared in the first part of the quarter, but quickly retreated as speculation waned. Despite the selloff after nearly reaching $69,000 in November, Bitcoin still gained 6% and closed at $46,333.
Disclosures
This was prepared by Oakhurst Capital Management, LLC (OCM), a federally registered investment adviser under the Investment Advisers Act of 1940. Registration as an investment adviser does not imply a certain level of skill or training. OCM Form ADV Part 2A & 2B can be obtained by written request directly to: 1875 Century Park East, Ste 950, Los Angeles, California 90067. The information herein was obtained from various sources. OCM does not guarantee the accuracy or completeness of such information provided by third parties. The information in this presentation is given as of the date indicated and believed to be reliable. OCM assumes no obligation to update this information, or to advise on further developments relating to it. Neither the information nor any opinion expressed constitutes an offer, or an invitation to make an offer, to buy or sell any securities. Any return expectations provided are not intended as, and must not be regarded as, a representation, warranty or predication that the investment will achieve any particular rate of return over any particular time period or that investors will not incur losses. Past performance is not indicative of future results. This is for informational purposes only. It does not address specific investment objectives, or the financial situation and the particular needs of any person. An index is a portfolio of specific securities, the performance of which is often used as a benchmark in judging the relative performance of certain asset classes. Indexes are unmanaged portfolios and investors cannot invest directly in an index. An index does not charge management fees or brokerage expenses, and no such fees or expenses were deducted from the performance shown. The S&P Indices are widely recognized, unmanaged indices of common stock. The S&P 500 Index is recognized as a gauge of the large cap U.S. equities market. The S&P Electric Utilities Index is a sub-industry group within the S&P 500 Index. The Dow Jones Industrial Average (DJIA) is a price-weighted average of 30 significant stocks traded on the New York Stock Exchange (NYSE) and the NASDAQ. The NASDAQ Composite is a stock market index of the common stocks and similar securities (e.g. ADRs, tracking stocks, limited partnership interests) listed on the NASDAQ stock market. The Commodity Research Bureau Index (CRB) is an index that measures the overall direction of 19 commodity sectors. The Consumer Price Index (CPI) measures changes in the price level of market basket of consumer goods and services purchased by households. All data sourced from Bloomberg as of December 31, 2021, unless noted otherwise.