BARRY JULIEN | June 30, 2023
A strange combination of several ancient and modern languages, English is littered with idiosyncrasies and nuances that can prove confounding to even native speakers. Two words spelled the same yet pronounced differently is often confusing, as is the creative pairing of seemingly contradictory terms regularly found in oxymorons. None other than William Shakespeare may have provided the most classic example of an oxymoron in English literature. In Romeo and Juliet, Romeo exclaims “O brawling love! O loving hate” as the start to a string of thirteen oxymorons. Though popularized by The Bard, the first recorded use of the term oxymoron dated back to 400 AD. Derived from the Greek words oksus, meaning “sharp or pointed” and moros, meaning “stupid or foolish,” the word itself is an example of an oxymoron. Popularity grew modestly for several centuries before ramping up significantly over the past fifty years.
Phrases including jumbo shrimp, small crowd, virtual reality, original copy, and civil war have become commonplace in our everyday conversations, though new oxymorons are occasionally introduced and prove to have some potential staying power. Most recently, with the interpretation of Federal Reserve monetary actions, the financial media should be credited with popularizing two new contradictory terms – the “dovish hike” and “hawkish pause.” As a reminder, central bank hawks are those that argue for higher interest rates to combat inflation and growth, while doves push for looser monetary policy to spur growth and inflation. Thus, at the early May meeting of the policy setting Federal Open Market Committee (FOMC), though the result was a 25-basis point increase in the federal funds rate, it was positioned as possibly the last hike before a prolonged pause. The introduction of this dovish hike was intended to let investors know that the Fed was likely finished or almost done with its rate hikes.
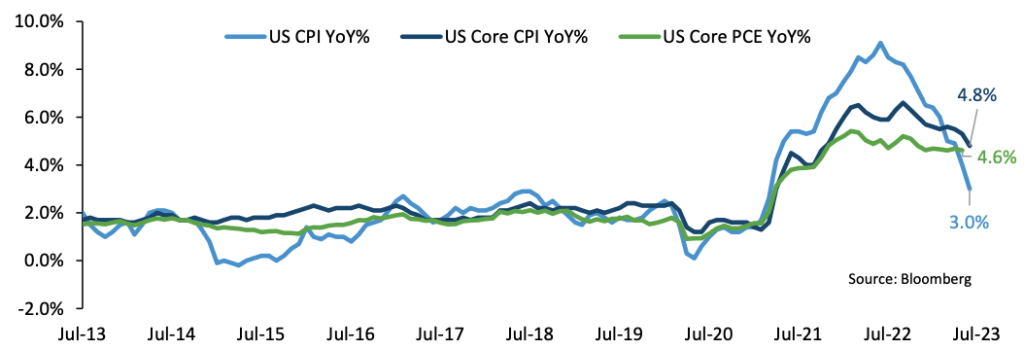
After a punishing tightening cycle, comprising ten rate hikes and 500 basis points, the signal of its completion should be welcomed by financial markets, corporations, and households. Of course, that is assuming the Fed has successfully carried out its mandate of stable prices and full employment. In the passing weeks since this decision, this presumption has been called into question. Despite numerous predictions by well-respected pundits, the domestic economy has weathered the storm and continues to grow at a reasonable rate. More concerning, of course, is that inflation, while having dropped meaningfully from its heights, remains sticky and well above the Fed’s 2% target. As of the May releases, though CPI has fallen to 4%, the core CPI measure of 5.3% and the Fed’s preferred core PCE price index at 4.6% have not dropped nearly as much and continue to haunt policymakers and investors. While most expect the employment sector to wane, the demand for labor continues to exceed supply. With 339,000 new jobs created in May, considerably above consensus, the slowdown is not yet evident in the broad numbers and the average monthly number of non-farm payrolls must decelerate to enable equilibrium.
Therefore, shortly after the dovish hike in May, economic releases continued to indicate stubbornly high inflation and modest growth, not the impending recession that most had anticipated. With the June FOMC meeting fast approaching, Fed members began publicly declaring that additional tightening may be necessary to quell lingering inflation. While rates were left unchanged at 5.25%, the updated predictions from the central bank, termed the dot plot, revealed surprisingly hawkish estimates. The Fed policymakers upgraded their consensus expectations for growth and inflation and, thus, projected two more rate hikes by the end of 2023. In his press conference immediately following the June meeting, Fed Chairman Powell reiterated the inflation-fighting rhetoric, helping to solidify the understandably deemed “hawkish pause.”
Great weight has historically been placed on the Fed’s economic projections, but is it justified? Despite more than 300 PhD economists on staff, the Fed has a very poor track record in predicting the economic future. With its recent blunders, most notably its characterization of inflation as transitory and the 2008 housing crisis as contained and unlikely to spread to other parts of the economy, investors should be weary of altering portfolios based upon Fed economic estimates.
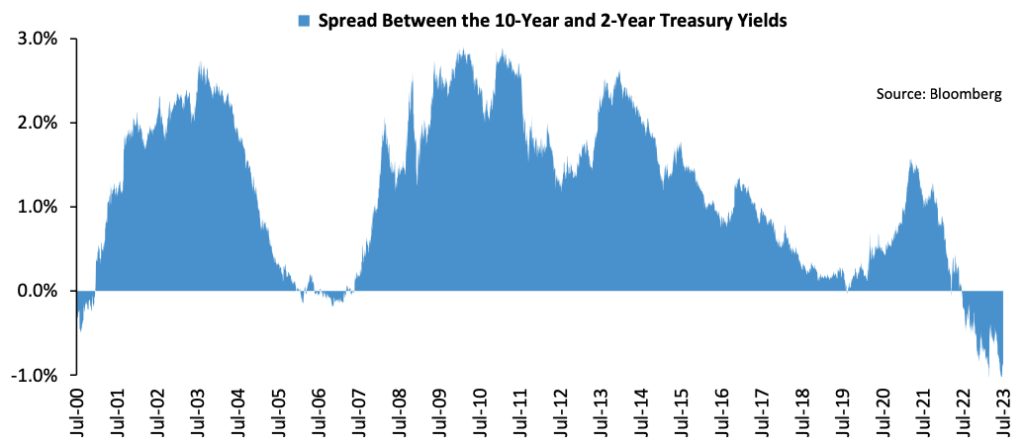
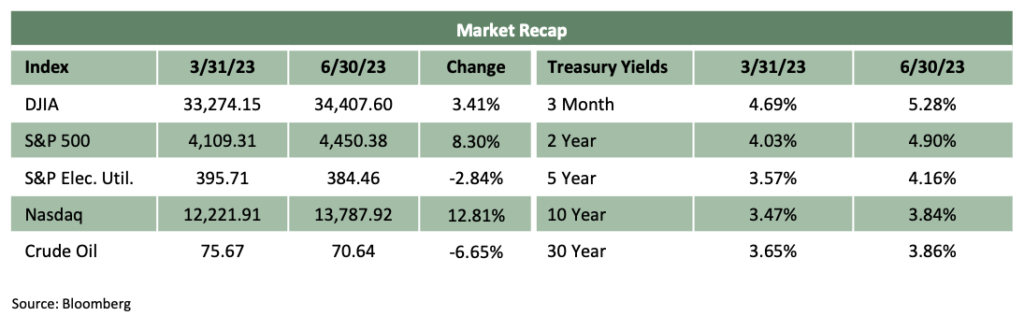
Over the past quarter, pundits have begun to question one of the most reliable economic predictors, the inverted yield curve. The presence of the inverted curve, in which the yield on short-term Treasuries exceeds those of longer-term ones, has foreshadowed all ten U.S. recessions since 1955. However, during this cycle, the 2-year yield began topping the 10-year as far back as April 1st, 2022, though it quickly steepened until early July 2022. Since then, the yield curve has remained inverted, having deepened over the past month to end the second quarter at negative 106 basis points. Yet, a year has passed and the economy has maintained positive growth, prompting numerous analysts to revisit their recessionary calls, often updating estimates for a soft landing.
Have the yield curve’s predictive abilities failed, ruining its perfect record since World War II? Not so fast proclaim many economists. Since monetary policy works with a lag, many estimate that the recession should begin within 6 to 24 months, with a 12-to-18-month window most likely. Therefore, the U.S. economy only recently entered the narrower window, providing some additional time before the current inversion signal may be considered fallible. Others advocate employing an alternative yield curve with superior predictive capabilities, the spread between the yield of the 3-month T-bill and the 10- year Treasury note. While also deeply inverted, this curve has been consistently negative only since November 2022, thus much earlier in the typical window for a recessionary environment.
Although recent strength has bolstered the outlooks for a soft landing, signs of weakness are plentiful. Contracting since late last year, manufacturing struggles have worsened, evinced by the ISM Manufacturing PMI reading in June of 46.0, the lowest of the current cycle. The service sector has slowed considerably from a year ago, though the June ISM Services reading of 50.3 indicated that this sector remained just above 50.0 and still in expansionary mode. Higher interest rates and inflation have weighed on household budgets, which should continue to crimp consumer spending and retail sales. Global growth has waned, with the hope that the reopening of the Chinese economy would boost other economies turning out to be a great disappointment.
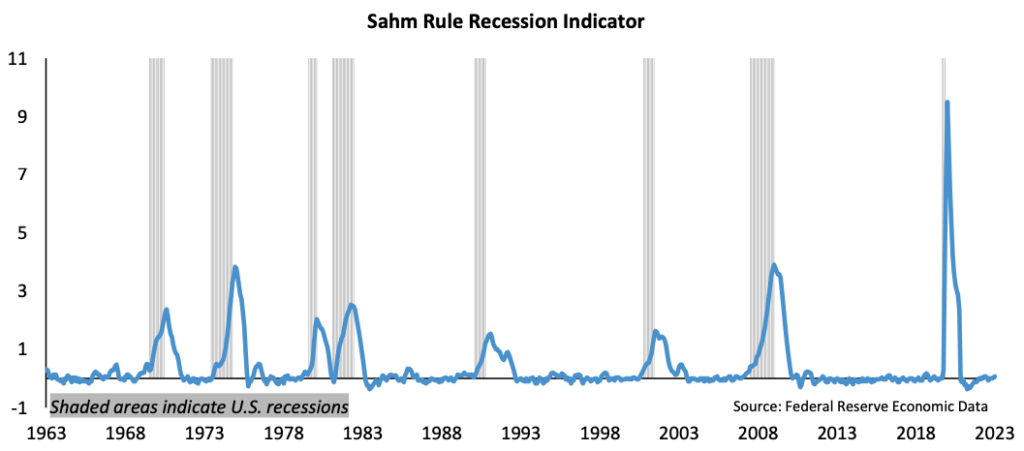
As noted earlier, the beacon of strength in the U.S. has been the employment sector, but a closer examination uncovers some cracks that have already formed. Observing the job market at a more local level illustrates that many states have experienced a sizeable increase in the unemployment rate. In fact, according to the Sahm Rule, which posits that a recession has commenced when the three-month moving average of the unemployment rate rises by 0.5% or more relative to the prior twelve months, 18 states have already entered recession. This relatively straightforward measure has great accuracy in calling a recession, though it is intended to do so at the national level of unemployment rather than that of the state. Nonetheless, there has been a noticeable weakening in some industries and regions, likely a precursor to a more broad- based retrenchment.
The purportedly positive resolution on the debt ceiling, while avoiding a potential catastrophe in financial markets, may produce liquidity strains and volatility. In reviewing the final days before the deal was finally reached, the Treasury’s General Account (GA), used to pay various government obligations, dropped all the way down to $23 billion. The Treasury often carries a balance between $400 billion to $500 billion and intends to build this fund back up to that range. But doing so will require very heavy issuance of Treasury bills, notes, and bonds, with much of the funds for these purchases coming out of the banking system. Thus, the economy had enjoyed a boost in liquidity when the GA was drained, yet now must endure a drain in liquidity as the account is replenished. Prior instances of sizeable liquidity tightening have resulted in financial market downturns. In fact, it is no coincidence that the yield curve inversion worsened following the suspension of the debt limit, with the deal announced at the end of May and signed in early June. The deluge of Treasury issuance will be heavily tilted to the shortest maturities, placing upward pressure on these yields and exacerbating the spread between short and long-term rates.
Certainly, the domestic economy has withstood the multitude of rate hikes in impressive fashion, confusing many prognosticators and even convincing some to adjust their forecasts. Though a soft landing is possible, it remains highly unlikely. The magnitude of monetary tightening will prove too onerous to overcome. Regardless of which yield curve one favors, both predict a recession with only a variation in timing. With oxymorons such as “dovish hike” and “hawkish pause” in vogue, it seems appropriate to forecast the “near certainty” of an upcoming recession. Considering the probability of difficult economic times ahead, equity and bond indices have fared rather well. Going forward, though, a reduction of risk is warranted.
Barry P. Julien, CFA®
Chief Investment Officer & Portfolio Manager
Market Snapshots
Equities
Increasing evidence of an economic slowdown did not deter the optimism of equity investors. Rather than relying on corporate earnings growth, which is expected to contract over the year, equity markets have cheered the expected end of Fed rate hikes and the hope for numerous interest rate reductions in the quarters ahead. Though the banking crisis did prompt a risk-off trade, investors quickly shook off the effects and increased the probability of rate cuts. While the Dow Jones increase was muted, the S&P 500 gained 8.74% and the Nasdaq soared 13.05% during the quarter. Information Technology and Communications were the clear leaders, while Financials and Energy stocks were the largest decliners.
Bonds
Benchmark bond yields fell as heightened expectations of recession triggered a flight to safety. As investors reduced risk throughout portfolios, investment grade corporate bond spreads widened. Interestingly, high yield bonds retreated during the banking turmoil, yet rebounded by the end of the quarter. The increased rate volatility negatively impacted mortgage- backed securities and the weakening consumer outlook resulted in wider spreads for asset-backed securities. Despite widening spreads, the move lower in rates enabled all sectors to produce solid returns.
Commodities
The combination of a safe-haven bid and sticky inflation pushed gold above $2,000 per ounce in March, though it closed just under this level at quarter end. Having closed 2022 near the $4 mark, natural gas prices plummeted to finish near a multi- year of $2.21 per BTU. Crude oil drifted lower as global economic weakness lowered demand. Overall, broad commodity indices fell approximately 2% with energy and livestock as the worst performers and industrial and precious metals turning in the best gains.
Currencies
Following the downturn in Q4, the US dollar continued to weaken as investors wagered that the Fed pause and pivot were quickly approaching. In addition, reports of global trading in non-dollar currencies and reduced accumulation of dollar reserves weighed on the greenback. Though inflation softened in Europe, the hawkish ECB helped the euro gain modestly against the dollar. The yen drifted modestly lower versus the dollar as safe-haven demand abated.
Disclosures
This was prepared by Oakhurst Capital Management, LLC (OCM), a federally registered investment adviser under the Investment Advisers Act of 1940. Registration as an investment adviser does not imply a certain level of skill or training. OCM Form ADV Part 2A & 2B can be obtained by written request directly to: 1875 Century Park East, Ste 950, Los Angeles, California 90067. The information herein was obtained from various sources. OCM does not guarantee the accuracy or completeness of such information provided by third parties. The information in this presentation is given as of the date indicated and believed to be reliable. Unless otherwise indicated, all data presented is sourced from Bloomberg L.P. OCM assumes no obligation to update this information, or to advise on further developments relating to it. Neither the information nor any opinion expressed constitutes an offer, or an invitation to make an offer, to buy or sell any securities. Any return expectations provided are not intended as, and must not be regarded as, a representation, warranty or predication that the investment will achieve any particular rate of return over any particular time period or that investors will not incur losses. Past performance is not indicative of future results. This is for informational purposes only. It does not address specific investment objectives, or the financial situation and the particular needs of any person. An index is a portfolio of specific securities, the performance of which is often used as a benchmark in judging the relative performance of certain asset classes. Indexes are unmanaged portfolios and investors cannot invest directly in an index. An index does not charge management fees or brokerage expenses, and no such fees or expenses were deducted from the performance shown. The S&P Indices are widely recognized, unmanaged indices of common stock. The S&P 500 Index is recognized as a gauge of the large cap U.S. equities market. The S&P Electric Utilities Index is a sub- industry group within the S&P 500 Index. The Dow Jones Industrial Average (DJIA) is a price-weighted average of 30 significant stocks traded on the New York Stock Exchange (NYSE) and the NASDAQ. The NASDAQ Composite is a stock market index of the common stocks and similar securities (e.g. ADRs, tracking stocks, limited partnership interests) listed on the NASDAQ stock market. The Crude Oil Index is the US Crude Oil West Texas Intermediate Cushing OK Spot price.